Thursday, August 28, 2008

The Eclipse Test & Performance Tools Platform

Profiling of Java using TPTP 4.5


The Eclipse Test & Performance Tools Platform (TPTP) Profiling tool can be used to profile local Java(TM) applications or complex applications running on multiple hosts and different platforms.
The tool is tightly integrated with Eclipse, allowing profiling of applications running from within Eclipse.This article demonstrates how to use the TPTP Profiling tool to profile a Java application for identifying execution related hot spots. It shows how to start the profiling session, use the various TPTP views to analyze the data, identify methods with high execution time then jump to the source code to fix the performance problem.This article was written using the TPTP 4.5 based on Eclipse 3.4

Starting the application in profiling mode

The first step is to run the product catalog application in profiling mode. Profile the application by using the Profile As > Java Application if you're using tests are declared in main function, or Profile As > Junit test


Setting the profile configuration

The Profile As > Profile Configuration... action will open the launch configuration wizard as displayed below.You should choose profiling method to use, also each method has additional options( click on Edit Options button).For instance editing options of Java profiling allows to define a different filtering on java classes.


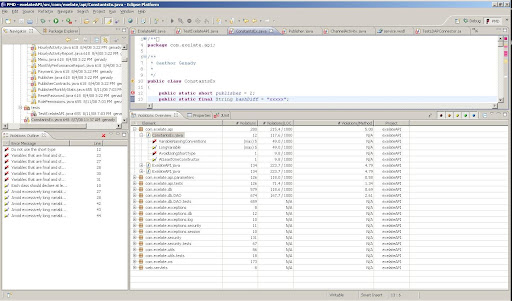
Identify performance hot spots using the Execution Statistics view


Use the Execution Statistics view to identify performance hot spots.You could view statistics on level package, class or functions.


Worth to mention that TPTP has Remote Agent to profile an applications are located and running on remote servers, more about this here:

http://dev.eclipse.org/viewcvs/index.cgi/platform/org.eclipse.tptp.platform.agentcontroller/src-native-new/packaging_md/linux/getting_started.html?root=TPTP_Project&view=co


Wednesday, August 20, 2008

AdventNet ManageEngine® Applications Manager

AdventNet ManageEngine® Applications Manager

1.Installation

Installation in linux was pretty easy, you just need to download bin file and run it from command line: ./ManageEngine_ApplicationsManager_8_linux.bin -console

I've accepted all default options( port, free edition, install location erc.)

2.Start: sh startApplicationsManager.sh

Starting Applications Manager "Primary" Server Modules, please wait ...
Process : AMScriptProcess [ Started ]
Process : AMExtProdIntegrationProcess [ Started ]
Process : AuthMgr [ Started ]
Process : AMDataCleanupProcess [ Started ]
Process : NmsPolicyMgr [ Started ]
Process : DBUserStorageServer [ Started ]
Process : NMSMServer [ Started ]
Process : AMUrlMonitorProcess [ Started ]
Process : NmsAuthManager [ Started ]
Process : WSMProcess [ Started ]
Process : NmsAuthenticationManager [ Started ]
Process : RunRmiRegistry [ Started ]
Process : NmsConfigurationServer [ Started ]
Process : RunJSPModule [ Started ]
Process : StandaloneApplnProcess [ Started ]
Process : ApplnStandaloneBE [ Started ]
Process : AMDistributionProcess [ Started ]
Process : AMCAMProcess [ Started ]
Process : NMSSAServer [ Started ]
Process : AMServerStartUp [ Started ]
Process : AMFaultProcess [ Started ]
Process : AMEventProcess [ Started ]
Process : AMServerFramework [ Started ]
Process : MapServerBE [ Started ]
Process : Collector [ Started ]
Process : DBServer [ Started ]
Process : AMDataArchiverProcess [ Started ]
Process : MonitorsAdder [ Started ]
Process : AlertFE [ Started ]
Process : NmsMainFE [ Started ]
Process : EventFE [ Started ]

Verifying connection with web server... verified

Applications Manager started successfully.

Please connect your client to the web server on port: 9090

3.Configuration

To install tomcat monitors first of all you need to install a manager applicaition on tomcat:

A default Tomcat installation includes the manager. To add an instance of the
Manager web application Context to a new host install the
manager.xml context configuration file in the
$CATALINA_HOME/conf/[enginename]/[hostname] folder. Here is an
example:

<Context path="/manager" debug="0" privileged="true"<br />         docBase="/usr/local/kinetic/tomcat5/server/webapps/manager"><br /></Context><br />
Restart tomcat, you should be able to load page : http://hostname8080/manager/status

To add a new monitor to tomcat, the only thing you need to remember is that user should have role manager in tomcat(tomcat-users.xml).

4.Monitoring: adding of a new monitors is straight forward, you just need to configure type of environment(dtabase, application server etc.), IP address and username/password.

mySQL database server was used for tests, mysql dashboard has a different graphs like queries statistics, open connections, memory used by databases. Interesting is that you could configure a different monitoring events to see a system notifications about certain pre-configured events. To monitor host ( mySQL installed on ) an SSH connection should pre-configured.

A few screenshots from mySQL monitoring dashboard:


Conclusion: Very impressive tool, has a lots options. As disadvantages worth to mention that a free edition is limited to a five monitors, e-mail support is limited to exchange server( gmail,yahoo,hotmail can't be used).

Sunday, August 17, 2008

Tomcat monitoring : Probe

Lambda Probe is a self sufficient webapplication, which helps to visualize various parameters of Apache Tomcat instance in real time. Lambda Probe is designed to work specifically with Tomcat so it is able to access far more information that is normally available to JMX agents. Here is a list of features available through Lambda Probe:
  • Comprehensive JVM memory usage monitor.
  • Display of deployed applications, their status, session count, session object count, context object count,
    datasource usage etc.
  • Start, stop, restart, deploy and updeploy of applications
  • Ability to view deployed JSP files
  • Ability to compile all or selected JSP files at any time.
  • Ability to pre-compile JSP files on application deployment.
  • Ability to view auto-generated JSP servlets
  • Display of list of sessions for a particular application
  • Display of session attributes and their values for a particular application. Ability to remove session attributes.
  • Ability to view application context attributes and their values.
  • Ability to expire selected sessions
  • Graphical display of datasource details including maximum number of connections, number of busy connections and configuration
    details
  • Ability to group datasource properties by URL to help visualizing impact on the databases
  • Ability to reset data sources in case of applications leaking connection
  • Display of system information including System.properties, memory usage bar and OS details
  • Display of JK connector status including the list of requests pending execution
  • Real-time connector usage charts and statistics.
  • Real-time cluster monitoring and clulster traffic charts
  • Real time OS memory usage, swap usage and CPU utilisation monitoring
  • Ability to show information about log files and download selected files
  • Ability to tail log files in real time from a browser.
  • Ability to interrupt execution of "hang" requests without server restart
  • New! Ability to restart Tomcat/JVM via Java Serview Wrapper.
  • Availability "Quick check"
  • Support for DBCP,C3P0 and Oracl datasources
  • Support for Tomcat 5.0.x and 5.5.x
  • Support for Java 1.4 and Java 1.5

Availability "Quick check"


Using this feature you can almost definitively monitor Apache Tomcat availability. "Quick check" does the following:

  • Scans all available datasources and generates maximum usage score
  • Allocates 1MB of memory into byte array
  • Creates and then deletes 10 files in temp directory


The check fails if either of the following is tru
e

  • At least one of the declared datasources is 100% used
  • Memory allocation test generated OutOfMemory exception
  • File creation test encountered an IOException


Lambda Probe also has XML version of "Quick check" for automated aplication monitoring tools.
Now let's take a look at real screens, Applications:


All deployed applications could be observed on this screen as URL
links,
for more detailed information click on application link, which shows a
different application parameters, for instance session:


on this screen session could be destroyed, you could see size of different session attributes.
In addition you Probe has session attributes, context attributes and requests screens.

Deployment: very important screen, if you want to view most updated tomcat


Nice functionality especially for those who don't want to deploy/redeploy a new applications manually.
Logs: very important screen for tomcat maintenance, you could even download log, wrap lines, pause update and etc.


System: shows memory statistics, tomcat memory parameters, computer information, enable to force garbage collector

Connector status: different statistics and charts about connection, traffic volume and number of requests.


Wednesday, August 13, 2008

Java static code tools : PMD review

PMD - ( Project Mess Detector?)

PMD scans Java source code and looks for potential problems like:
  • Possible bugs - empty try/catch/finally/switch statements
  • Dead code - unused local variables, parameters and private methods
  • Suboptimal code - wasteful String/StringBuffer usage
  • Overcomplicated expressions - unnecessary if statements, for loops that could be while loops
  • Duplicate code - copied/pasted code means copied/pasted bugs.
Release used: 2008-05-20 PMD 4.2.2

Eclipse PMD plugin installation was straight-forward:
  • Select "Help"->"Software Updates"->"Find and Install"
  • Click "Next", then click "New remote site"
  • Enter "PMD" into the Name field and "http://pmd.sf.net/eclipse" into the URL field
  • Click through the rest of the dialog boxes to install the plugin
Worth to mention that PMD has support of almost all java IDE's are available on the market today, you could run it as ANT task and most important that all rules could be customized with PMD rule designer.
To run you just need right click on your source tree node and to choose "PMD/Check code with PMD".


Well thought to quit coding after FindBugs found about 300 bugs, but 2625 ... In PMD perspective view you could filter a found bugs by importans, it's about five categories. To generate HTML just right-click on project PMD/Generate reports.
Repors are have very simple view. all issues are not sorted by any criteria, so it make a very difficult to view about 2000 issues and to find a really something important to fix.


Conclusions: If you want to follow all java notations and standarts, write one of your own this tool is could be very usefull.

Sunday, August 10, 2008

Java static code analisys tools : FindBugs review - Find Bugs in Java Programs

FindBugs logo
UMD logo
Fortify logo
SureLogic logo


FindBugs - Find Bugs in Java Programs

FindBugs IS a program which uses static analysis to look for bugs in Java code. It is free software, distributed under the terms of the Lesser GNU Public License.

FindBugs requires JRE (or JDK) 1.5.0 or later to run.However, it can analyze programs compiled for any version of To review was used version of FindBugs 1.3.5-dev-20080618, released on 13:39:38 EDT, 18 June, 2008.

Installation and running an UI tool was trivial, you just unpack zip archive and run findbugs.bat, were found 288 bugs in our code - pretty impressive !!!

You may use the FileSave as...
menu option to save your work. To save your work, including the jar file lists you specified and all bug results, choose "FindBugs analysis results (.xml)" from the drop-down list in the "Save as..." dialog. There are also options for saving just the jar file lists ("FindBugs project file (.fbp)") or just the results
("FindBugs analysis file (.fba)"), but these are rarely needed.A saved file may be loaded with the FileOpen... menu option.

Annotions support:FindBugs supports several annotations to express the developer's intent so that FindBugs can issue warnings more appropriately. You need to use Java 5 to use annotations, and must place the annotations.jar and jsr305.jar
files in the classpath while compiling your program.

  • edu.umd.cs.findbugs.annotations.CheckForNull
  • edu.umd.cs.findbugs.annotations.CheckReturnValue
  • edu.umd.cs.findbugs.annotations.DefaultAnnotation
  • edu.umd.cs.findbugs.annotations.DefaultAnnotationForFields
  • edu.umd.cs.findbugs.annotations.DefaultAnnotationForMethods
  • edu.umd.cs.findbugs.annotations.DefaultAnnotationForParameters
  • edu.umd.cs.findbugs.annotations.NonNull
  • edu.umd.cs.findbugs.annotations.Nullable
  • edu.umd.cs.findbugs.annotations.OverrideMustInvoke
  • edu.umd.cs.findbugs.annotations.PossiblyNull
  • edu.umd.cs.findbugs.annotations.SuppressWarnings
  • edu.umd.cs.findbugs.annotations.UnknownNullness
  • edu.umd.cs.findbugs.annotations.UnknownNullness
  • net.jcip.annotations.GuardedBy
  • net.jcip.annotations.Immutable
  • net.jcip.annotations.NotThreadSafe
  • net.jcip.annotations.ThreadSafe


  • You can refer the JCIP annotation
    API documentation
    at Java Concurrency in Practice.

    FindBugs Eclipse plugin

    To install an Eclipse plugin just use this URL:http://findbugs.cs.umd.edu/eclipse/


    Using the FindBugsAnt task

    Of cause to make such tool is useful you need to make it part of build process, in order to provide an another perspective for R&D team to predict a possible problems that could cause happened in production environment, or just to find out a weak design spots in code.

    Using FindBugs ant task was also simple, you just need to copy find-bugs.jar to ANT directory and change configuration parameters( such source and classes location, etc.). To view final results is possible by using XML report style in ant task and opening a produced XML report in FindBugs GUI, or changing report type to HTML type, which produce single page HTML report with default XSL stylesheet(could be customized) looking like(only headers):

    Metrics

    10483 lines of code analyzed,

    in 175 classes,
    in 18 packages.


    MetricTotalDensity*
    High Priority Warnings40.38
    Medium Priority Warnings28427.09

    Total Warnings

    288

    27.47


    (* Defects per Thousand lines of non-commenting source statements)


    Contents


    Summary


    Warning TypeNumber

    Bad practice Warnings
    57

    Correctness Warnings
    6

    Malicious code vulnerability Warnings
    209

    Performance Warnings
    8

    Dodgy Warnings
    8

    Total

    288

    Then is coming a detailed description of each warning or error are found with location and cause details, looks like:
    MS
    com.api.ConstantsEx.publisher isn't final but should be


    Bug type MS_SHOULD_BE_FINAL (click for details)

    In class com.exelate.api.ConstantsEx
    Field com.exelate.api.ConstantsEx.publisher
    At ConstantsEx.java:[line 12]


    Conclusions: FindBugs is looks like an easy-use and usefull tool to improve R&D methodologies.
    Pros: Easy to use and adopt, support annotations, ant task and html reporting.
    Cons: HTML report is looks very 'poor', single page, hard to look through all problems are found, after you get to one warning description and want to look for another one, you should go back to beginning of report.