- Comprehensive JVM memory usage monitor.
- Display of deployed applications, their status, session count, session object count, context object count,
datasource usage etc. - Start, stop, restart, deploy and updeploy of applications
- Ability to view deployed JSP files
- Ability to compile all or selected JSP files at any time.
- Ability to pre-compile JSP files on application deployment.
- Ability to view auto-generated JSP servlets
- Display of list of sessions for a particular application
- Display of session attributes and their values for a particular application. Ability to remove session attributes.
- Ability to view application context attributes and their values.
- Ability to expire selected sessions
- Graphical display of datasource details including maximum number of connections, number of busy connections and configuration
details - Ability to group datasource properties by URL to help visualizing impact on the databases
- Ability to reset data sources in case of applications leaking connection
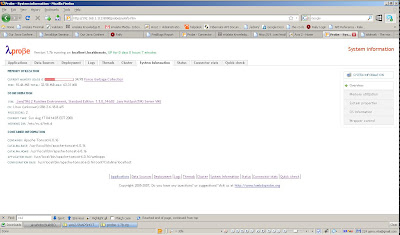
- Display of system information including System.properties, memory usage bar and OS details
- Display of JK connector status including the list of requests pending execution
- Real-time connector usage charts and statistics.
- Real-time cluster monitoring and clulster traffic charts
- Real time OS memory usage, swap usage and CPU utilisation monitoring
- Ability to show information about log files and download selected files
- Ability to tail log files in real time from a browser.
- Ability to interrupt execution of "hang" requests without server restart
- New! Ability to restart Tomcat/JVM via Java Serview Wrapper.
- Availability "Quick check"
- Support for DBCP,C3P0 and Oracl datasources
- Support for Tomcat 5.0.x and 5.5.x
- Support for Java 1.4 and Java 1.5
Availability "Quick check"
Using this feature you can almost definitively monitor Apache Tomcat availability. "Quick check" does the following:
- Scans all available datasources and generates maximum usage score
- Allocates 1MB of memory into byte array
- Creates and then deletes 10 files in temp directory
The check fails if either of the following is true
- At least one of the declared datasources is 100% used
- Memory allocation test generated OutOfMemory exception
- File creation test encountered an IOException
Lambda Probe also has XML version of "Quick check" for automated aplication monitoring tools.Now let's take a look at real screens, Applications:
All deployed applications could be observed on this screen as URL
links,
for more detailed information click on application link, which shows a
different application parameters, for instance session:


on this screen session could be destroyed, you could see size of different session attributes.
In addition you Probe has session attributes, context attributes and requests screens.
Deployment: very important screen, if you want to view most updated tomcat

Nice functionality especially for those who don't want to deploy/redeploy a new applications manually.
Logs: very important screen for tomcat maintenance, you could even download log, wrap lines, pause update and etc.

System: shows memory statistics, tomcat memory parameters, computer information, enable to force garbage collector

Connector status: different statistics and charts about connection, traffic volume and number of requests.


No comments:
Post a Comment