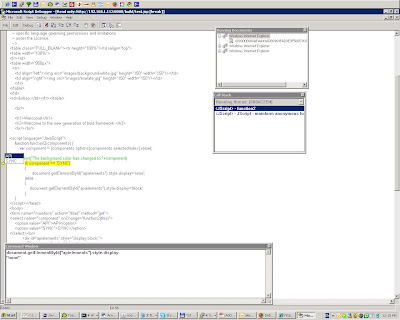
HOW-TO: Debug JavaScript in Internet Explorer
It seems that best tool for debugging JavaScript on Internet Explorer is the Microsoft Script Editor, a free component of Microsoft Office XP/2003. There are other options - Microsoft Visual Studio .Net, which pretty expensive if all you need is JavaScript debugging for IE.- Turn on debugging in IE

- Get Microsoft Script Editor
Now check again view->Script debugger, if you see that, then you have Script Editor installed. Congratulations! Otherwise consider to change your professional area :)
- Using Script Debugger
This causes the debugger to activate the next time any JavaScript executes. If you then select “step into code” (F11) the javascript file that contains the code will load automatically.
Alternately, you can put a line like this in your Javascript code.
debugger;
It will create a breakpoints automatically, if this breakpoint gets hit, your debugger will launch. You will see a message that says "An exception 'runtime error' has occurred in script. Possible Debuggers:".
- Usage
Debugger short keys:
- Run: F5
- Stop debugging: Shift F5
- Step into: F8
- Clear all breakponts: Ctrl+Shift+F9 - Toggle breakpoint: F9 - Step over: Shift+F8
- Step out: Ctrl+Shift+F8
Worth to mention that besides 'Call stack' window with script stack information and 'Running documents', debugger has 'Command window', where you could run functions and see data in a different program variables.

Mozilla's JavaScript Debugger:
http://www.hacksrus.com/~ginda/venkman/
https://addons.mozilla.org/en-US/firefox/addon/216
FireBug:
https://addons.mozilla.org/en-US/firefox/addon/1843
Debugging javascript in Google Chrome:
http://www.alexatnet.com/node/180


No comments:
Post a Comment